


We have been walking through the McLain et al (2018) paper that used baraminology to try to feather dinosaurs. Up to now, we’ve been working on the first dataset they used. Today we will be moving into the second dataset, from Lee et al. We will be starting with the first graph of this dataset, figures 32 and 33 of the McLain paper.
We trimmed down the Lee dataset to match the taxa McLain et al used in their paper. Having done so, we were left with 57 taxa. We then ran the resultant data for bootstrapping values at seventy-five percent relevance, in both BDISTMDS and BARCLAY. Bootstrapping values ranged all over the map, from 100, to the mid 40s. One value in BARCLAY was 28, which is the lowest value I have seen so far. The overall trend was true of both BDISTMDS and BARCLAY. Some bootstrapping values were good, others were not. Again, I have to ask why at least a mean bootstrapping value was not reported for the dataset?
It may seem like I’m nitpicking by constantly bringing up the bootstrapping. I can see why people might think that, but, according to the model proposed by Wood, bootstrapping was supposed to be a measure of data reliability. Given the issue of feathered dinosaurs is a particularly touchy one within the young earth community, it would seem to have been wise to do what the statistical baraminology literature requires and calculate bootstrap values.
Having calculated the bootstrapping values, we proceeded to use both BARCLAY and BDISTMDS to make graphs of the dataset. Unsurprisingly, they were incredibly messy. There could be a couple reasons for this messy appearance with a lot of taxa and a decent number of characters. It could be (and in this case likely is) due to the number of kinds contained in the dataset. While its difficult to tell from screenshots (I had to shrink them significantly to capture the whole thing due to their size), the dataset consists of Tryannosaurids, true birds (Archaeoptyrx), Raptors, and several other potential baramins. With that much smoke, its not surprising the picture is fuzzy. Which leads me to ask the question of “what was the point of even showing these” since all they do is cloud the analysis. However, let’s have a look at the fog and see if we notice anything.
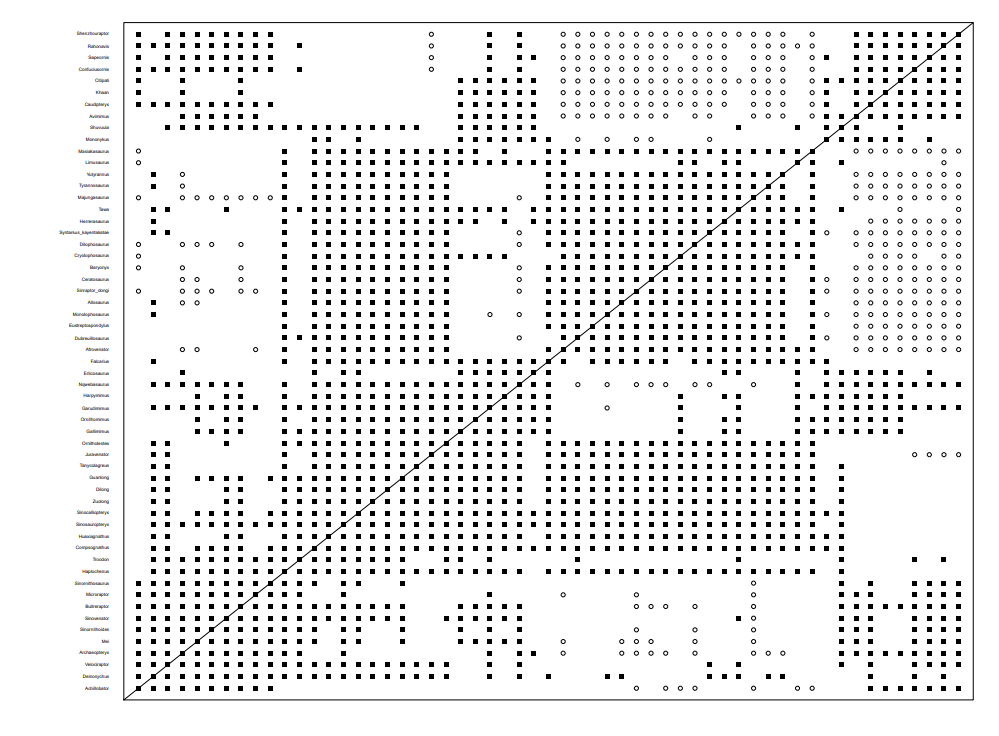
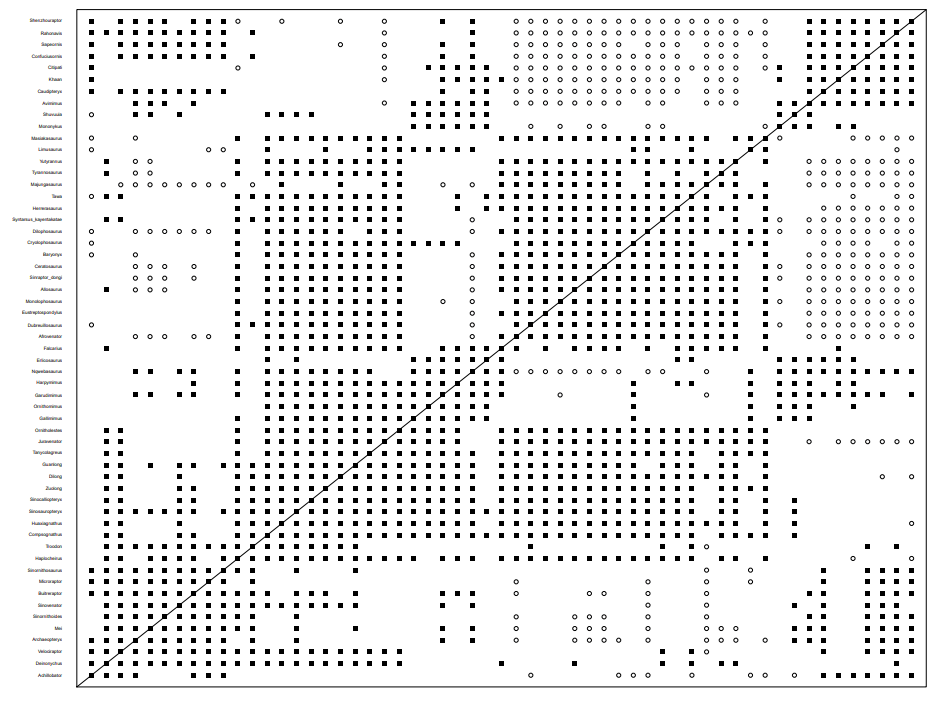
As you can see, both of the above graphs are very messy. There are three general groups, but its very difficult to make anything out of them. It’s hard to tell without going over every square, but the continuity and discontinuity measures seem to be roughly the same, with some minor variations between the two. Unfortunately, their similarity only means they are equally messy.
We turn next the the MDS plots. Remember the MDs plots are completely subjective. That said, with how messy the graphs are, it should surprise no one that the MDS plots are equally messy.
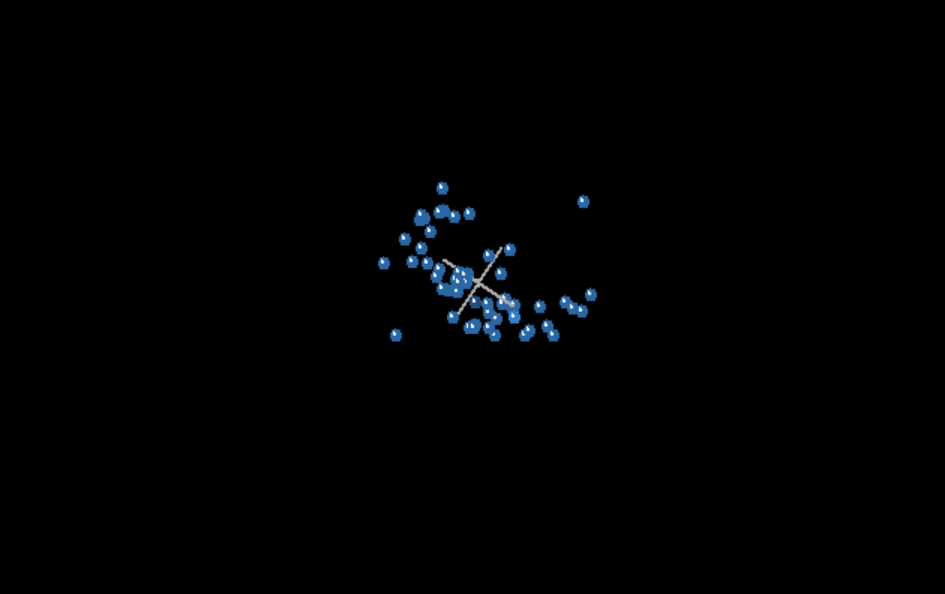
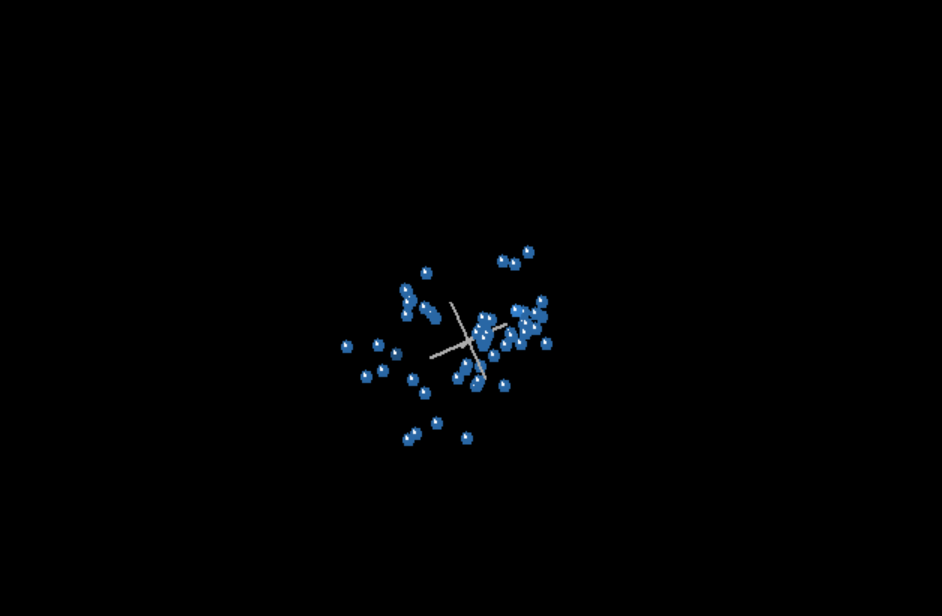
As you can see, there is not much that can be gleaned from the MDS plots. They are blobs of taxa, with no clear delineators between groups. I should point out here that the MDS is irrelevant anyway because it views organisms merely as a collection of parts. The problem here, is organisms are not just a collection of parts. We all know this intuitively. You could take all the parts of a lion, rearrange them and make a completely different looking animal. Arrangement of parts matters, and the MDS completely ignores this crucial aspect of organismal complexity, it is utterly worthless as a tool to determine baramins. However, since its part of the methodology, we will continue to use it to most accurately repeat McLain et al’s work.
So what can we learn from the jumbled mess above? I think the pattern is clear, based on what we have seen from the Brussatte and Lee datasets. Too many kinds included in the analysis clouds the results. Further, more characters is not always better. It seems statistical baraminology is very vulnerable to statistical noise. Keep those things in mind as we continue to work our way through the McLain et al 2018 paper.
Do you know what’s going to happen when you die? Are you completely sure? If you aren’t, please read this or listen to this. You can know where you will spend eternity. If you have questions, please feel free to contact us, we’d love to talk to you.
