


In previous parts of this series, we have been analyzing McLain et al’s baraminology in their 2018 paper that attempted to peddle the feathered dinosaur myth packaged in creationist wrapping. As we have seen so far, the datasets they used have been somewhat sketchy at best, and bad at worst. Very rarely do even the sub-datasets provide clarity. In this week’s edition, we are going to examine figures 34 and 35.
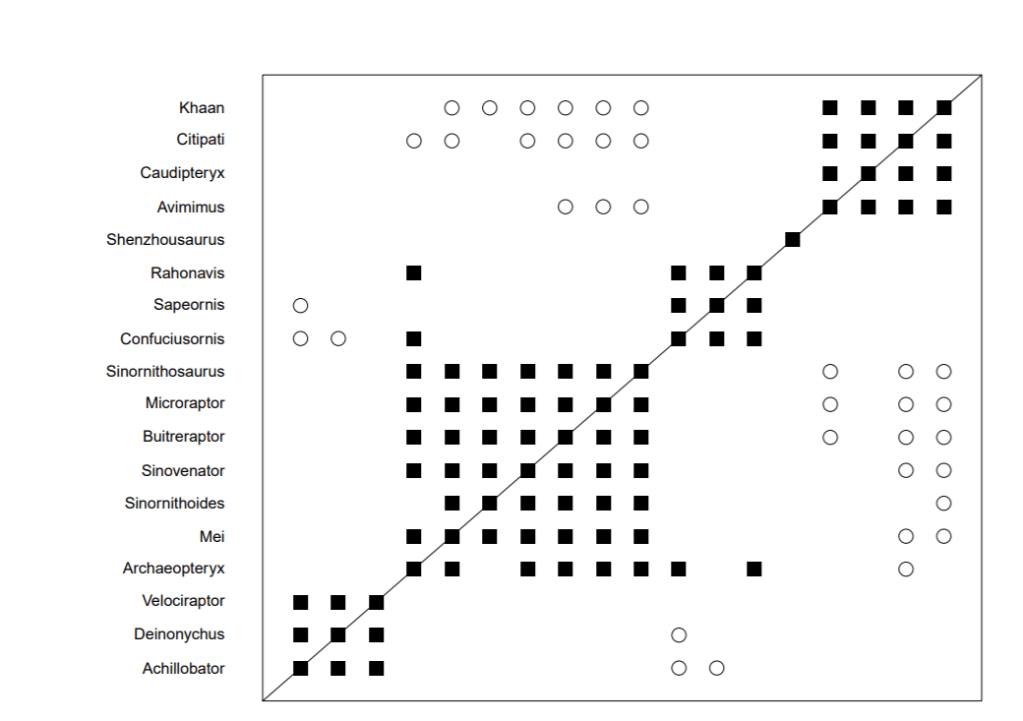
Again, these figures used the Lee dataset, which McLain trimmed down to include just the Pennaraptor group. We imitated the McLain et al dataset exactly. The resultant dataset contained eighteen taxa. There are at least a few taxa in here (Confuciusornis etc) that everyone acknowledges are birds so it will be interesting to see what the results are. With fewer taxa, the resultant graphs will likely be less clouded by statistical noise as well. In this instance, 231 character were used which, in theory, should lead to clearer results as the standard error will drop with additional taxa. Bootstrapping results for both BDISTMDS and BARCLAYs were moderately good. There were quite a few 100%s, indicating good data, as well as many high eighties and nineties. However, there were some equally bad results with one value hitting a mere 37%. That value was the worst I observed, but there were a few other in the forties and fifties. Again, I have to ask why bootstrapping values were not reported? I recognize the paper is monstrous (nearly 40 pages), but at that point, adding an additional table or two barely makes a dent so there is no point excluding it.
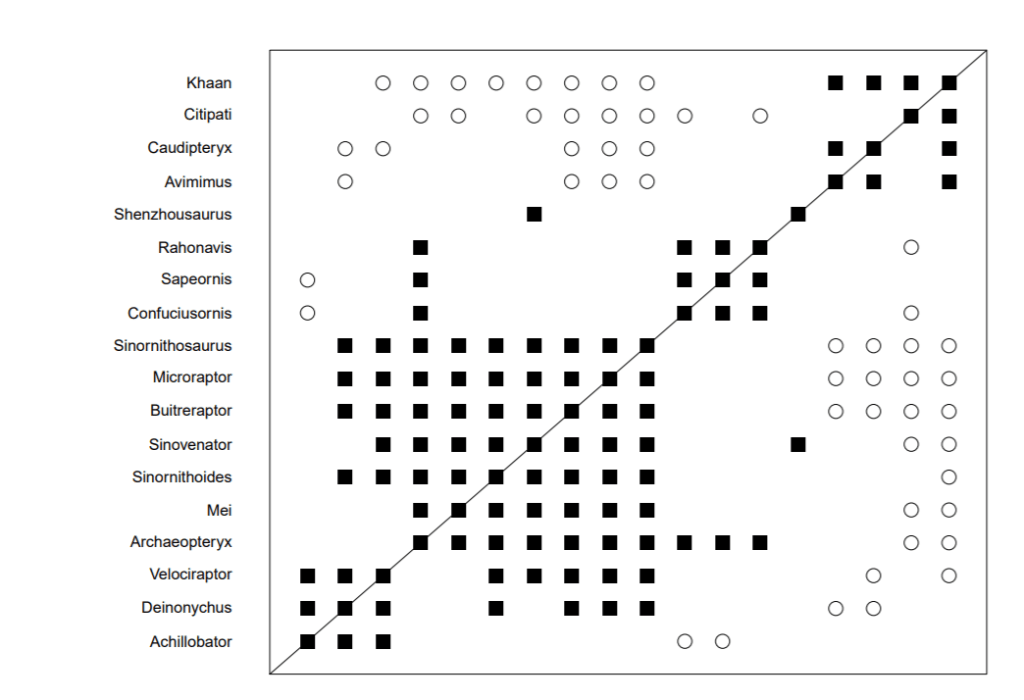
Having calculated boostraping values, I then ran the dataset through BDISTMDS and BARCLAY. Unsurprisingly, BDISTMDS matched the McLain et al original paper perfectly. There were four groups, two of which were linked by two taxa. However, BARCLAY revealed a much different result. Much more continuity was found between the two middle groups and the bottom group as well, and much more discontinuity was detected between the central grouping and other groups. In BDISTMDS as shown below, there are two fairly distinct central groupings. In BARCLAY, these groups essentially fuse along with the bottom group so that there are just two, instead of three-four groups. The top group in BARCLAY also becomes fractured. whereas it is not in BDISTMDS. Again this raises the question of whether BARCLAY will be even less successful at detecting discontinuity than BDISTMDS, which fails 45% of the time anyway, according to its own inventor.
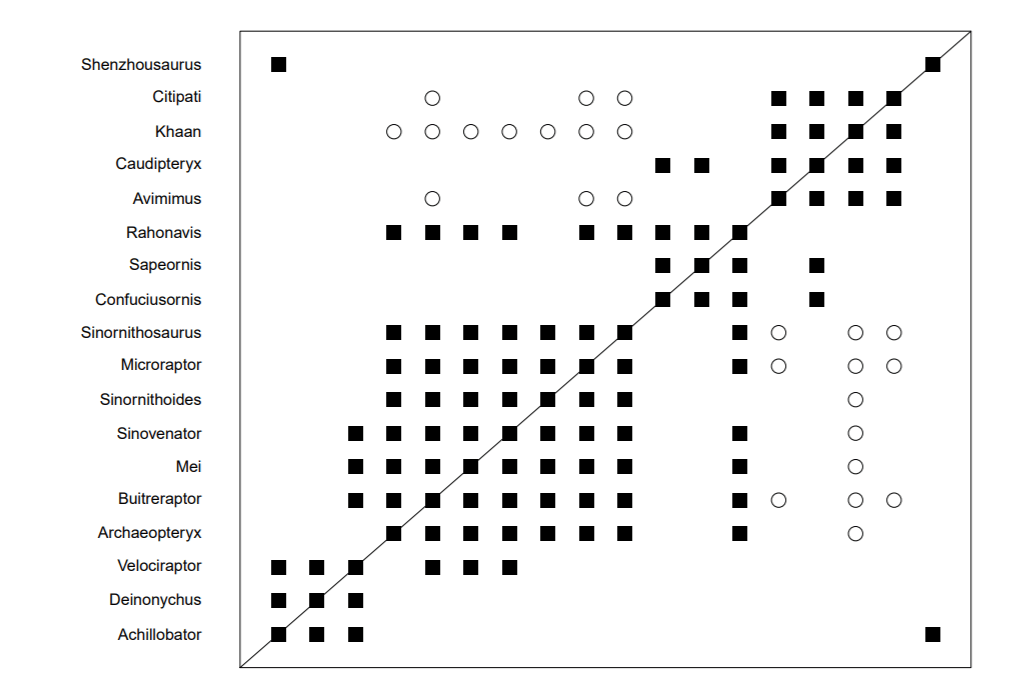
As a test, I then reran both analysis at 85% relevance cutoffs. This level of character relevance retained 81 characters for analysis. As you can see below, the BDISTMDS graph lumped the two middle groups, but separated out the bottom group and the top group, as well as moved Shenzhousaurus out on its own. Continuing the trend, BARCLAY analysis found much less discontinuity and more continuity between the groups. All the boundaries broke down and the groups sort of melded together into one group. Given that Confuciusornis and Velociraptor were almost certainly not the same kind, this analysis is clearly wrong. However, again, BARCLAY has found more continuity than BDISTMDS. I can’t put my finger on why yet. Hopefully I will be able to diagnose it soon.

Having completed the graphs, we moved to the MDS plots. As a reminder or for anyone new to the series, MDS plots are completely subjective, but they are part of the method so we are using them here. Interestingly, McLain el al’s figure 35, both views presented are tetrahedral, something that, was there any consistency in statistical baraminology, would have resulted in rejection of the dataset. However McLain et al completely overlook the tetrahedral geometry of the MDS plot, despite Wood having used it multiple times to reject result he either disliked, or were unBiblical. As you can see, the MDS plots at 75% relevance are tetrahedral for both BDISTMDS and BARCLAY
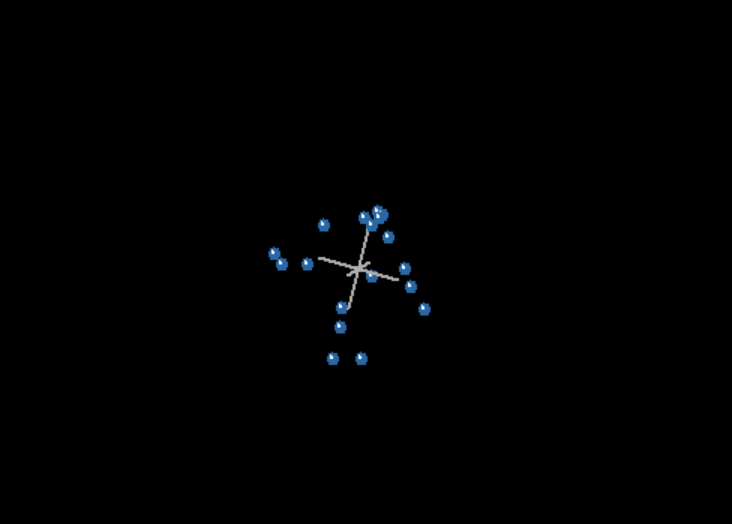
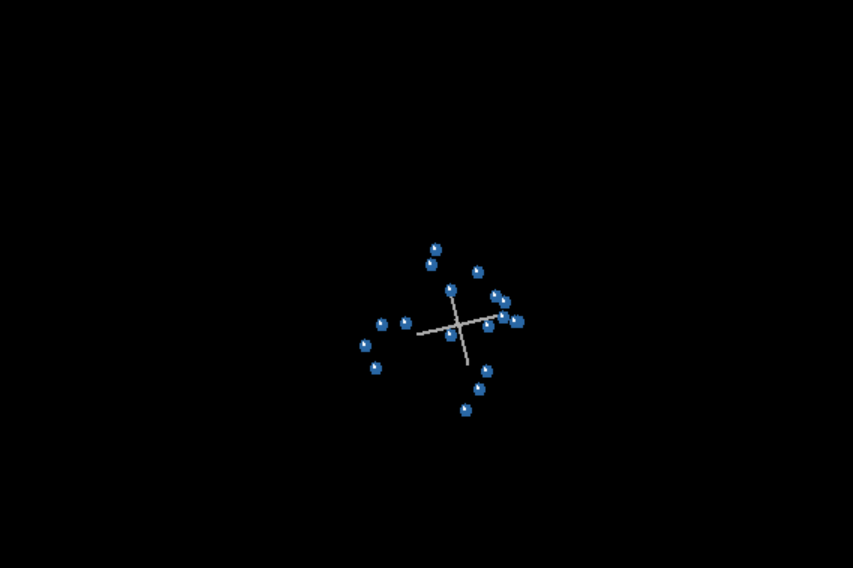
In both cases above, the MDS plot shows tetrahedral geometry, with BARCLAY being worse. According to the standards of statistical baraminology, this sub-dataset should have been rejected outright. Yet McLain et al completely ignore their own method’s precedent. Nor is the problem resolved at the 85% relevance cut off as shown below.
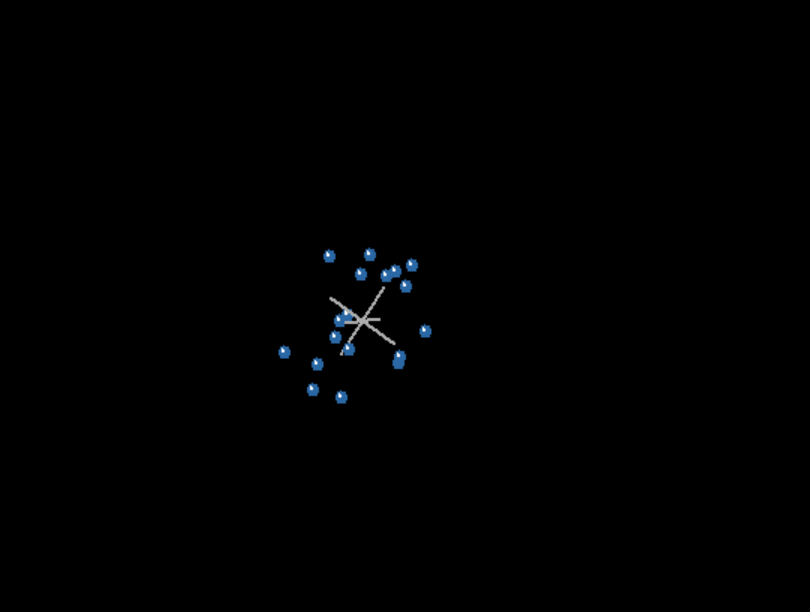
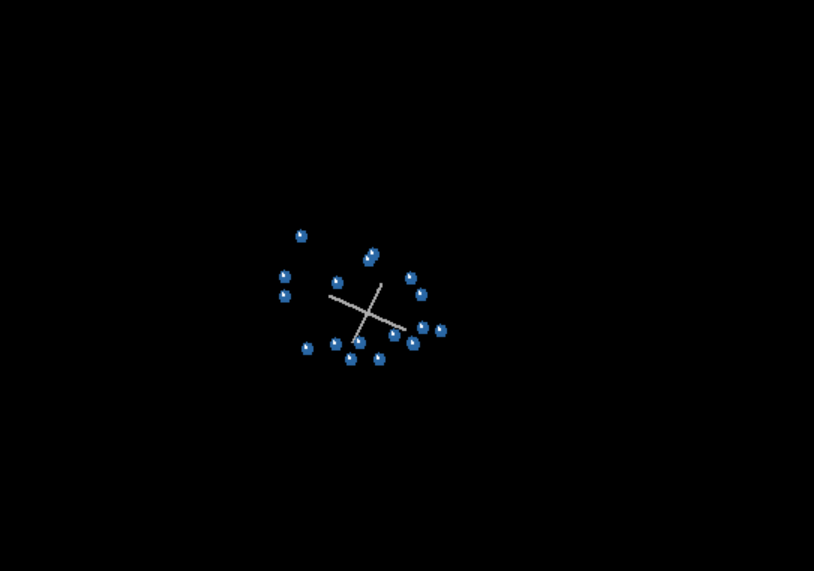
In this instance, the BARCLAY plot is slightly better, but still tetrahedral. McLain et all make no attempt to explain why they overlooked previous work in the field to simply accept this result and run with it. And this is not the first time we’ve seen tetrahedral geometry get a pass in this paper.
As a further note, a trend I am noticing is more data is not always better. The graphs were significantly clearer with only 81 characters rather than 231 used at the 75% relevance cut off. It will, of course, depend on the characters retained for analysis, but there the 75% cut off is arbitrary and should not be the only cutoff tried for fossil taxa given, as we have seen in this series, it does not always provide the clearest results.
Do you know what’s going to happen when you die? Are you completely sure? If you aren’t, please read this or listen to this. You can know where you will spend eternity. If you have questions, please feel free to contact us, we’d love to talk to you.
