


We’ve been working our way through McLain et al (2018)’s attempt to put feathers on dinosaurs using baraminology. We’ve been working our way through the paper and we’ve now reached figures 42 and 43. These figures are the non-pennaraptoran coelurosaurs. As we work through this, its important to remember that the entire statistical baraminology artifice is built on the façade of objectivity but is constructed of unverifiable statistical models that are riddled with errors and often produce inaccurate results. But we can ignore all that because consensus says they work…or something.
I imitated McLain’s data exactly from the Lee et al dataset. Twenty-two taxa were used for analysis. Of the over 1500 characters, only 189 were retained for analysis at the 75% relevance cutoff, speaking to the incompleteness of the dataset. Bootstrapping values varied strongly between the mid-40s, and 100, with most seeming to fall in the sixties and seventies. I’m starting to sound like a broken record here, but I have to ask why bootstrapping values were not included in the paper? Was it because the values are supposed to inform people whether the data is good or not, informed the authors the data wasn’t good, and they did not want to present that? I don’t think so, but it leaves the question open.
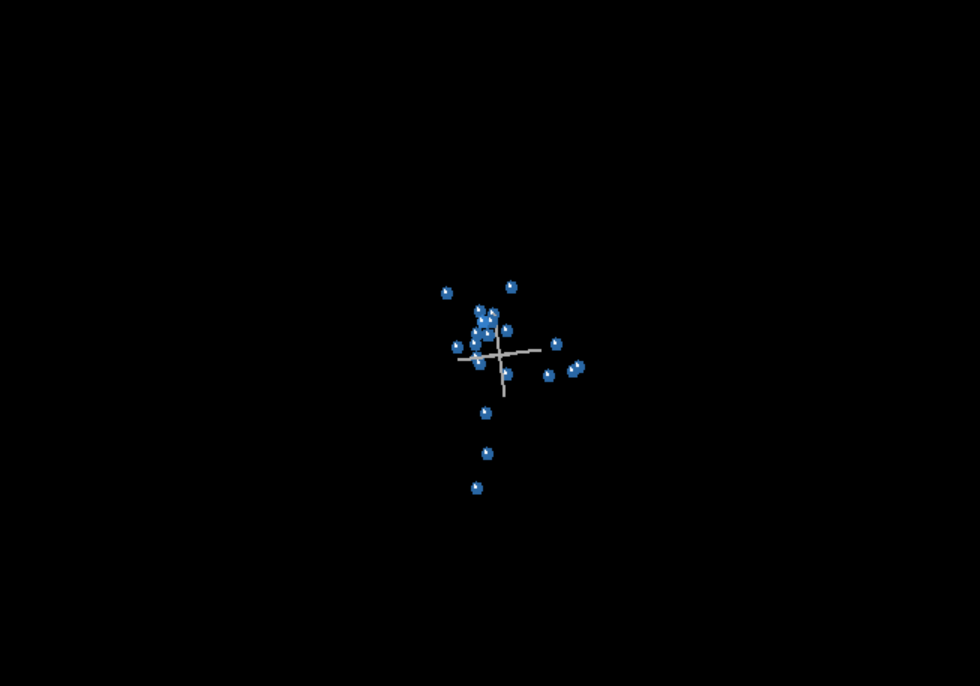
Having finished looking at the bootstrapping values, I went ahead and ran the graphs. The graph from BDISTMDS was fairly similar to the McLain paper, though with slight differences. In this instance I think I know why. Normal BDISTMDS sets the taxic relevance cutoff at .66. McLain et al reduced it to .25 for the Lee dataset. This opens up a whole can of worms of other possible changes that changing taxic relevance might make in the code. That said, here are the graphs. As is becoming normal, BARCLAY shows much more continuity and much less discontinuity than BDISTMDS.


As you can see, BARCLAY finds significantly more continuity than BDISTMDS and significantly less discontinuity. However, both form roughly the same number of groups. The two taxa at the top form one group and basically all the rest can be linked together based on connective links. Running the data at higher character relevance (85% and 95%) does nothing to solve these issues. This being the case we need to see if the subjective MDS plots will be in any way helpful.
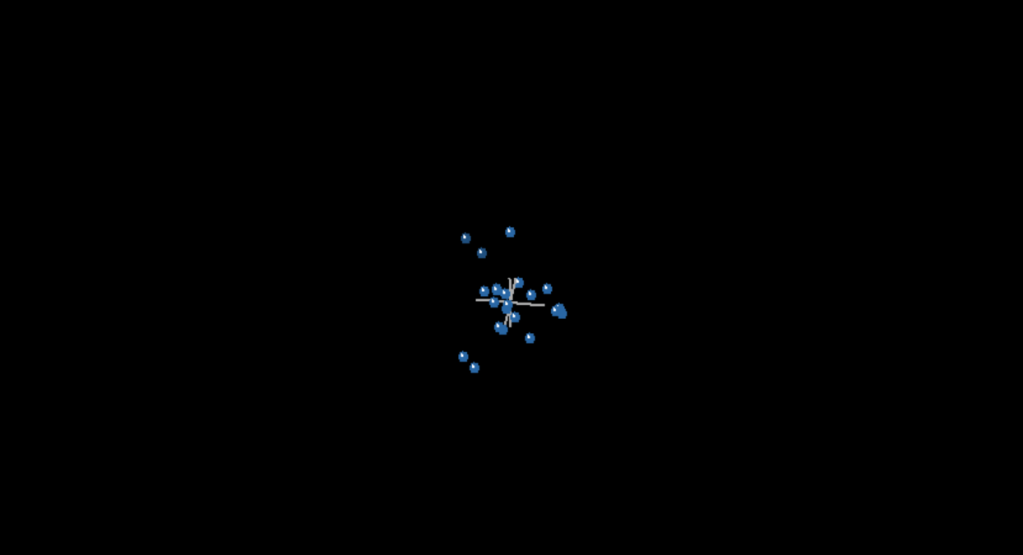
As you can see, the MDS plots are fairly similar. There are a few differences between them of course, the graphs are different. However the MDS plots do have some differences between them, again, to be expected based the methods differing slightly.
So what can we learn from these graphs and plots? Basically nothing. There is a strong grouping in the BDISTMDS among the bottom taxa, but that grouping becomes clouded in the BARCLAY. I think the biggest takeaway of this method has nothing to do with the dinosaurs. It has to do with the method itself.
The problem with the method comes from its subjectivity. The veneer of statistics aside, the the method is only as good as the data it is fed. And the data in most of these fossils datasets is rather lacking. The fact that so few characters were used for analysis out of such a large dataset leads me to believe one of two things: either the data is completely unreliable, or several different kinds are present in the dataset. The fact that the method does not identify multiple kinds could mean the method is bad, or that there is not enough data in the dataset to delineate them. Regardless, none of those things make the MDS any less subjective. You literally can read an MDS plots however you want. I could argue that the above MDS plots represent twenty different kinds and other than the intuitive absurdity, no one could prove me wrong.
Unfortunately, statistical baraminology is completely unreliable. However, due to the complexity of the terms, and the veneer of statistical objectivity, most people think that statistical baraminology is objective and have accepted feathers on dinosaurs based on the conclusions of McLain et al. That is very unfortunate because its simply not factual. As we continue to work through this series, we will find that statistical baraminology, and the McLain paper, are very much in error.
Do you know what’s going to happen when you die? Are you completely sure? If you aren’t, please read this or listen to this. You can know where you will spend eternity. If you have questions, please feel free to contact us, we’d love to talk to you.
