

We have been working through McLain et al (2018)’s attempt to put feathers on dinosaurs using baraminology. As we have seen so far, the only thing useful we can take away from the results is that either the data, or the method is bad. As we dig into figures 44 and 45 this week, we’ll have to see if we can sort out which one is at fault for the ongoing string of sloppy results.
The data for this week consists of 19 taxa of the non-maniraptoran coelurosaurs, plus Falcarius. Exactly why Falcarius is included with this group is unclear. However, as per usual, we duplicated the data exactly and ran bootstrapping values. Of the nearly 1600 characters, only 217 were used for comparison. This is slightly more than an eighth of the available data. Now, given most of the “data” consists of question marks, this is hardly unexpected but it does raise significant questions about the quality of the data available.
Bootstrapping values were calculated for both BARCLAY and BDISTMDS. In each case, they were instructively mediocre. In some cases they were 100, but in quite a few they were sub 90 and some even in the low 60s. Not the worst bootstrapping values we’ve seen so far, but definitely not great. Again, I have to ask why bootstrapping values were not reported. They’re supposed to give clarity on how good your data is but were either ignored or simply not reported in the McLain et al paper.
Having looked at the bootstrapping values, I ran BDC graphs of the data using both BARCLAY and BDISTMDS. The BDISTMDS plot was similar, but not identical to the published data. I can only assume that this is due to a lowered taxic relevance. With the Lee data, McLain et al used a taxic relevance of .25. The standard taxic relevance is .66. As far as I know, no experimental tests were done to see what effect changing the taxic relevance would have on the BDISTMDS algorithm. This is a huge problem because it removes any veneer of scientific empiricism from the McLain et al results. They have no clue what that change in the methodology will produce and, frankly, I don’t either. Its fine to change the method and report the results of the test. But do not tell me that dinosaurs had feathers based on a method that has NEVER been experimentally tested to see if it works and that, even in its base form, FAILS 45% of the time! I’m sorry, that’s not science, that’s imposing your preferred outcome on the data. And, given McLain has literally said “birds are dinosaurs” I think we know what the preferred outcome was.
As frustrating as the bad science behind these results are, we have to look at them. As expected, the BARCAY and BDISTMDS results differ from one another. And if you’ve been reading this series long enough, you know that BARCLAY found more continuity than BDISTMDS and less discontinuity. Which makes me wonder BARCLAY is viewed as an improvement? It isn’t. It’s worse at detecting discontinuity and better at detecting continuity. But the whole point of statistical baraminology is finding significant holistic discontinuity, which BARCLAY fails to find. So exactly how is this an improvement over BDISTMDS? Anyway, results below.


Notice how BDISTMDS has three neat little groups that do not overlap and even have some discontinuity around them? Yeah that all goes away in BARCLAY. In fact, BARCLAY adds significant continuity and removes most of the discontinuity. I have to ask if Dr. Wood tested this before he made it public? Because it sure looks like BARCLAY is significantly worse at detecting discontinuity than BDISTMDS and I’m certain that’s not what he wanted.
Just for fun before running the completely subjective MDS plots, I moved the BDC character relevance cut offs up to 85, then 95 percent. This reduced the number of characters available, but at the 95% level significantly improved resolution. There were three distinct groups in the BARCLAY data and two in the BDISTMDS data. However only 6 characters were used. I’m not convinced that is necessarily bad however. I would need to do more experiments with the method to see if more taxa, more characters, or something in the middle would be most useful.

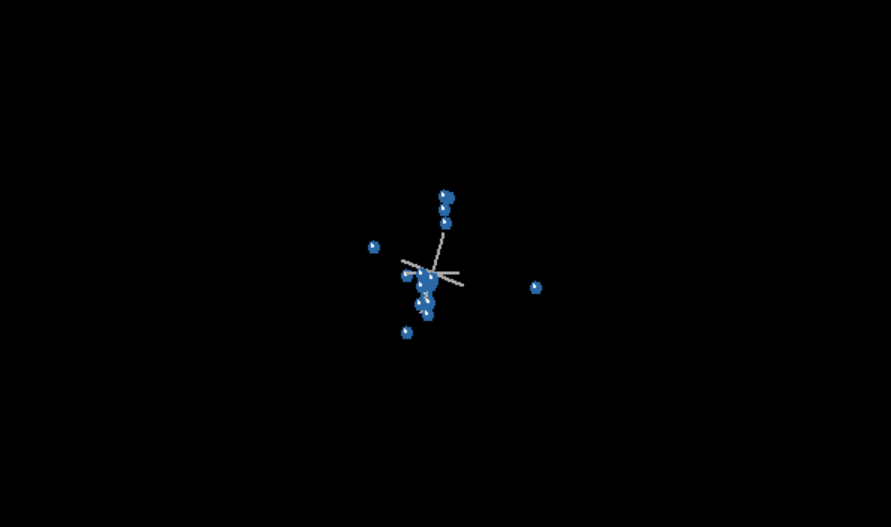
As you can see, the MDS plots are pretty similar. That should be good, except, they take on a characteristic tetrahedral shape. Now, according to Wood, that’s grounds for rejecting the result. However, that was not done here. Of course, I could spin this MDS plot in three dimensional space to make it look less tetrahedral, and in fact McLain et al did just that, illustrating how absurdly subjective MDS plot interpretation is. The whole statistical baraminology system is built on poor operational science, terribly subjective interpretations of data, and consenting silence from those involved. No longer. Statistical baraminology has set baraminology back by three decades. It’s time for a change.
Do you know what’s going to happen when you die? Are you completely sure? If you aren’t, please read this or listen to this. You can know where you will spend eternity. If you have questions, please feel free to contact us, we’d love to talk to you.
