


In the previous two articles of this series, we have examined the first two iterations of first dataset used in McLain et al’s attempt to feather dinosaurs. As we have seen so far, the dataset seems to be laden with issues, likely due to including too many taxa from disparate kinds and being fragmentary due to the nature of fossils. I’m starting to come to the conclusion that this dataset (and the paper) is absolutely worthless, but more on that in a later article. For now, lets get into what McLain et al did in their third diagram.
In their third breakdown of the dataset, McLain et al split off the Tyranosaurids and the “basal” Coelurosaurids. I did likewise in my attempt to imitate them. I ran the same dataset of organisms through both BDISTMDS and BARCLAY to get bootstrapping values, as these are not reported in the paper. For the first time, the bootstrapping values are not too bad. Mostly in the mid-80s and 90s across the board. There were a few lower ones, but much less than in previous iterations of the dataset. These are the first bootstrapping results I’ve seen I would be comfortable with saying, using the statistical baraminology system, are acceptable.
Having examined the bootstrapping values, I ran the datasets again, this time to reduce the graphical representation. 164 characters were used and all twenty one taxa were retained for analysis. For reference, the original dataset contained 860 characters. Unsurprisingly, both BDISTMDS and BARCLAY produced graphs essentially identical to the original graph.
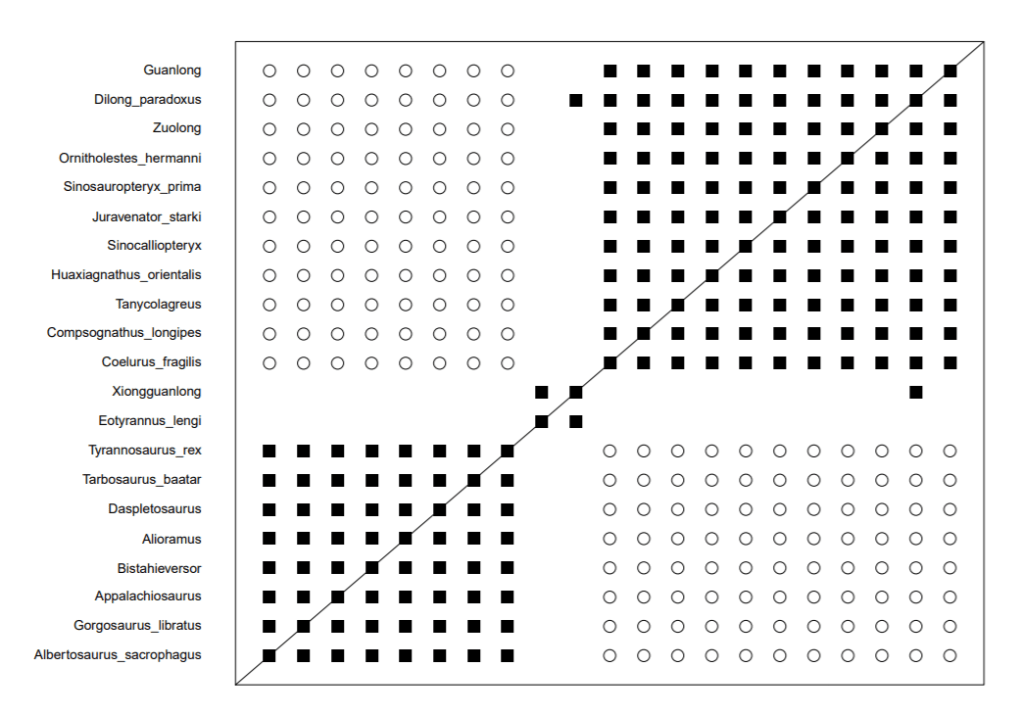
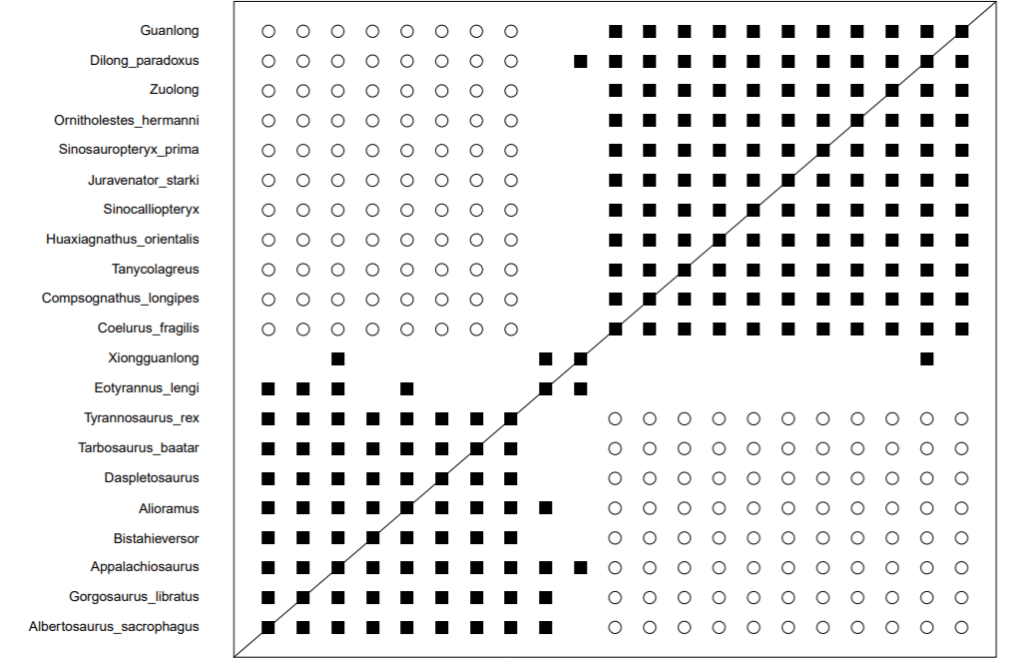
There is only two minor differences between the two. BARCLAY shows correlation between Xiongguanlong and Appalachiosaurus, which is absent in the BDISTMDS results and Eotyrannus shows positive correlation with a number of the Tyrannosaurids. What is more striking is how clean cut the two groups are. Very little links them, unlike previous analyses where there has been significant overlap and discontinuity surrounds the two groups. While McLain et al regarded this as three separate groups since neither Eotyrannus nor Xiongguanlong overlapped with the Tyrannosaurids, the BARCLAY results reduce this to two groups, as both taxa overlap.
This raises significant questions. In the last post, we questioned whether BARCLAY was going to be even worse at properly determining discontinuity than BDISTMDS, which failed 45% of the time. What we have here could be another warning sign. Note that, with Eotyrannus now being continuous with the Tyrannosaurids, there is a complete link between the Coelurosaurs and the Tyrannosaurs. It’s not a strong link, hinging on the link between Dilong and Xiongguanlong but its not one that can be ignored either as it appears in both BDISTMDS and BARCLAY. Obviously these two groups are not members of the same baramin, but you could argue based on the above charts that they were related.
Interestingly, when I did my rerun at higher relevance cut offs, I discovered a potential solution to the problem. The dataset would not run at 95% but at 85% what I found was, the two groups separated perfectly into two baramins, bounded by discontinuity. It did reduce the dataset to 54 characters, but perhaps the below results should give baraminologists reason to question the arbitrary 75% cut off for fossils

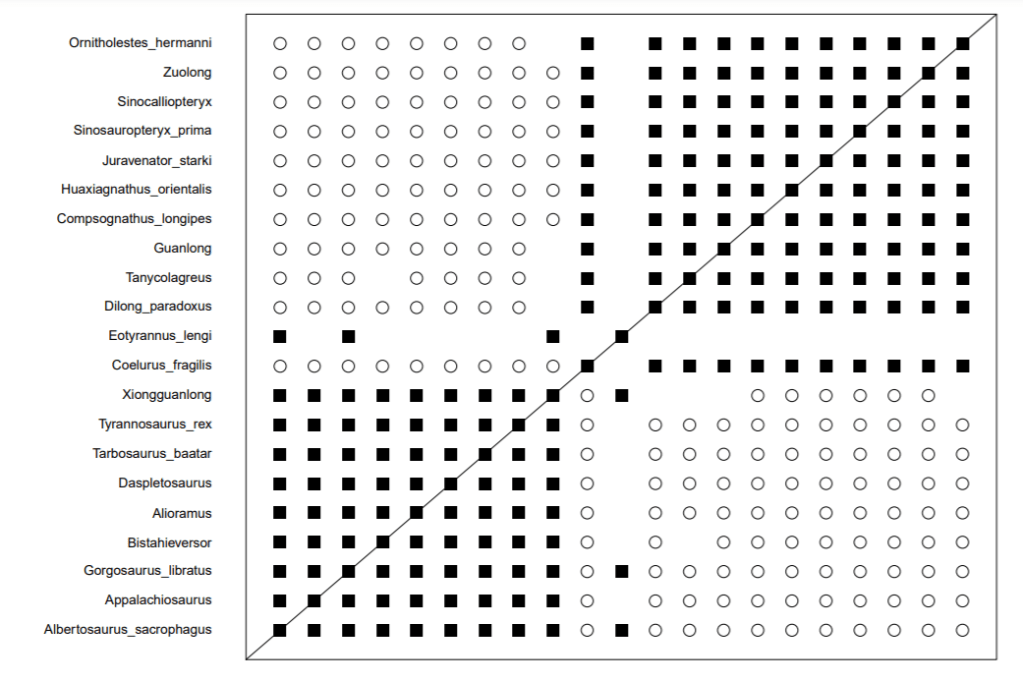
Note in these results Eotyrannus and Xiongguanlong nest neatly into the the Tyrannosaurids and the link to Dilong disappears. These results appear to be a more natural understanding of these organisms. I should point out here that the BDC equation regards every similarity as the same so filtering out some similarities that are not indicative of relationship might be a wise idea. Alternatively, adding weight to characters unique to a group in question might also be useful. Just some thoughts for the future.
Having discovered that the 85% cut off works so well for these taxa, I next ran the MDS for both methods at both cut offs. This is where I got into some very interesting issues. Below are the MDS plots for 75% relevance cut offs.
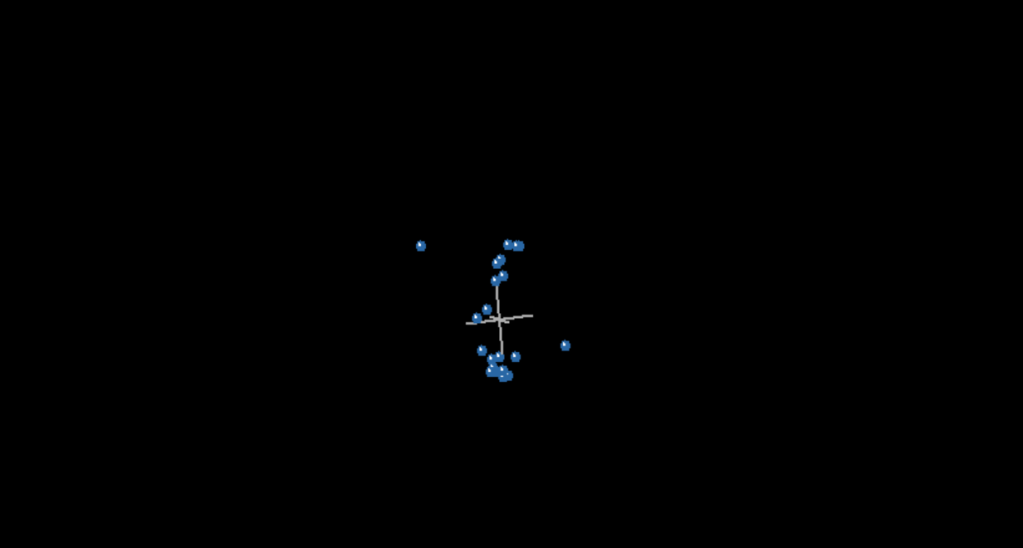
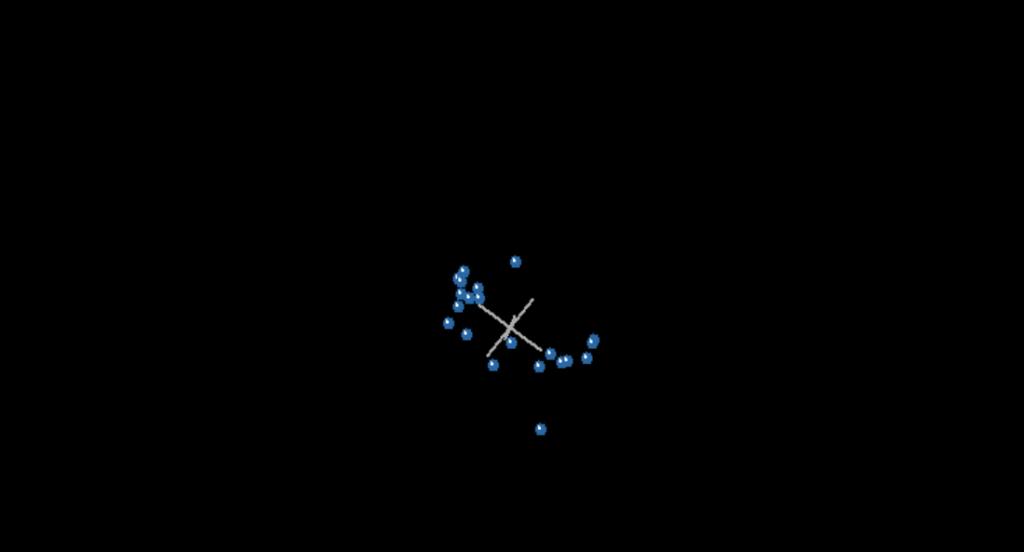
Note that there are two groups here, but notice also that there are two taxa that stick out like sore thumbs, one on the top, the other on the bottom. That would be Bistahieversor and Coelurus. In fact, in all four graphs, these taxa represented the outliers, one at the top, the other at the bottom. I would not make a huge deal about this were it not for the fact that, in the view of the statistical baraminologists, this is grounds to reject the dataset.


Let me explain what I mean. In numerous previous studies, when statistical baraminologists came up with results that separated breeding groups, thereby violating the Biblical definition of a kind, the results were rejected, but not on Biblical grounds. Instead they were rejected based on the tetrahedral shape of the MDS. Ladies and gentlemen, the MDS presented here is most definitely tetrahedral. McLain et al never mention this. Not once. The word “tetrahedral” does not appear in their paper. In fact, this is their explanation for the tetrahedral geometry of the MDS. “Bistahieversor and Coelurus are
located in unusual spots.” Thats it. Not one word about how previous datasets were rejected for having this tetrahedral geometry. I’d like to give them the benefit of the doubt here but figures 21, 23, and 25 all show this tetrahedral geometry and that’s just of what I covered so far. Further, McLain at least knows of the tetrahedral geometry argument presented by Wood. So why was this data retained when previous data showing the same shape was previously rejected?
The tetrahedral shape of this data, and the fact it was published without question, raises some significant questions. Is statistical baraminology seriously so relativistic that tetrahedral geometry is fine when it makes the case you want it to make but is bad when it doesn’t? Or was this just a sloppy mistake by people who don’t know the method very well? I seriously hope it was the latter but why did no reviewer catch it? Surely someone should have noticed that there were multiple instances of tetrahedral geometry in the paper? And why did Dr. Wood not catch it? He’s in the paper’s acknowledgements as been helpful discussing baraminological issues. Was he not shown the full paper? So many unanswered questions, but it is summed up in one word: trainwreck. This is the best we can do in baraminology? Really? This error alone should invalidate the McLain et al paper and cause it to be retracted. It won’t be, but it should be. We’re only three graph sets into the paper and already I have no reason to trust their conclusions as, at least the Brusatte dataset, is a disaster. More to come, so stay tuned.
Do you know what’s going to happen when you die? Are you completely sure? If you aren’t, please read this or listen to this. You can know where you will spend eternity. If you have questions, please feel free to contact us, we’d love to talk to you.
